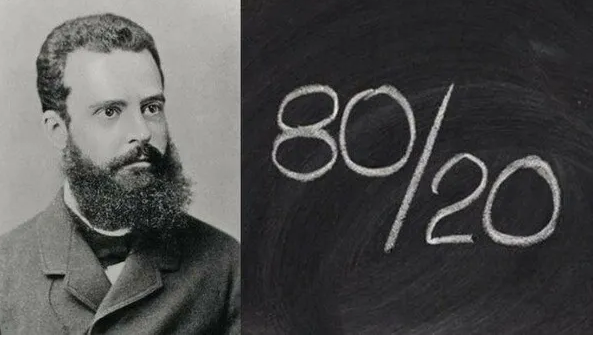
Also known as the 80/20 rule, it’s a principle formulated by the Italian philosopher and engineer Vilfredo Federico Pareto that will aid you in productivity.
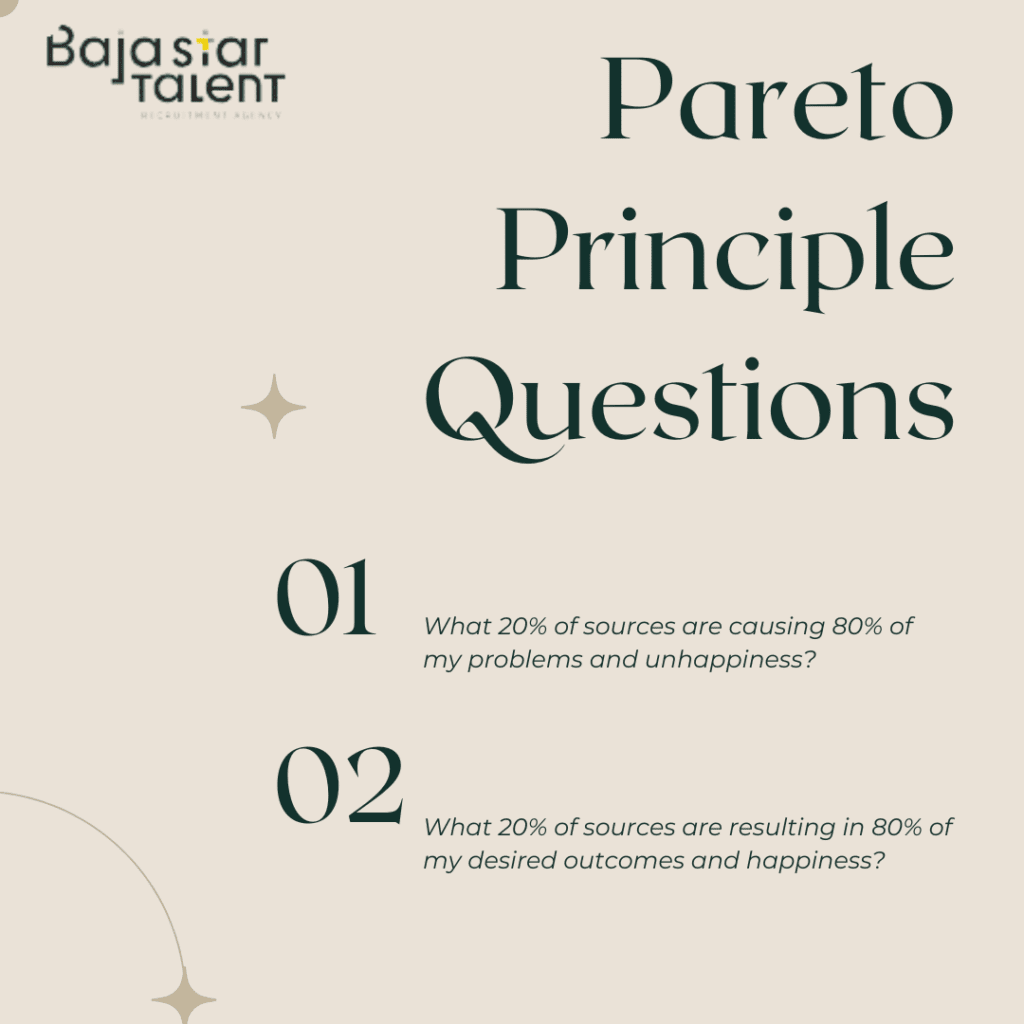
The Pareto principle, also known as the 80/20 rule, describes a phenomenon that states that roughly 80% of results come from 20% of actions.
Formulated by the Italian philosopher and engineer Vilfredo Federico Pareto in 1896, it extends from productivity notions to explanations for a company’s gains. If you observe closely, the gains or what is obtained from a process depend on 20% of the effort made.
To test his theory, Vilfredo Pareto studied land ownership in Italy and thus concluded that 20% of the owners possessed 80% of the land. On the other hand, the remaining population (80%) only owned 20% of the properties.
The principle is applicable in different fields, including management in companies. In work settings, it helps focus and concentrate on what is truly important, resulting in increased productivity and profitability.
And easily verifiable. 80% of failures in a company’s processes come from 20% of the workers. 20% of the team’s efforts produce 80% of the results a company obtains. 80% of workplace accidents are caused by 20% of the risks present in the company.
How to make the diagram and what it’s for
The Pareto diagram is a graphical tool for sorting data from highest to lowest and thus understanding more clearly which aspects should be addressed first, where efforts should be concentrated, and what is a priority.
This type of diagram consists of bars representing any unit of measurement and lines determining the accumulated percentage. Beyond this, to create it, you must follow a series of steps that can help apply the principle more easily to any process in your company.
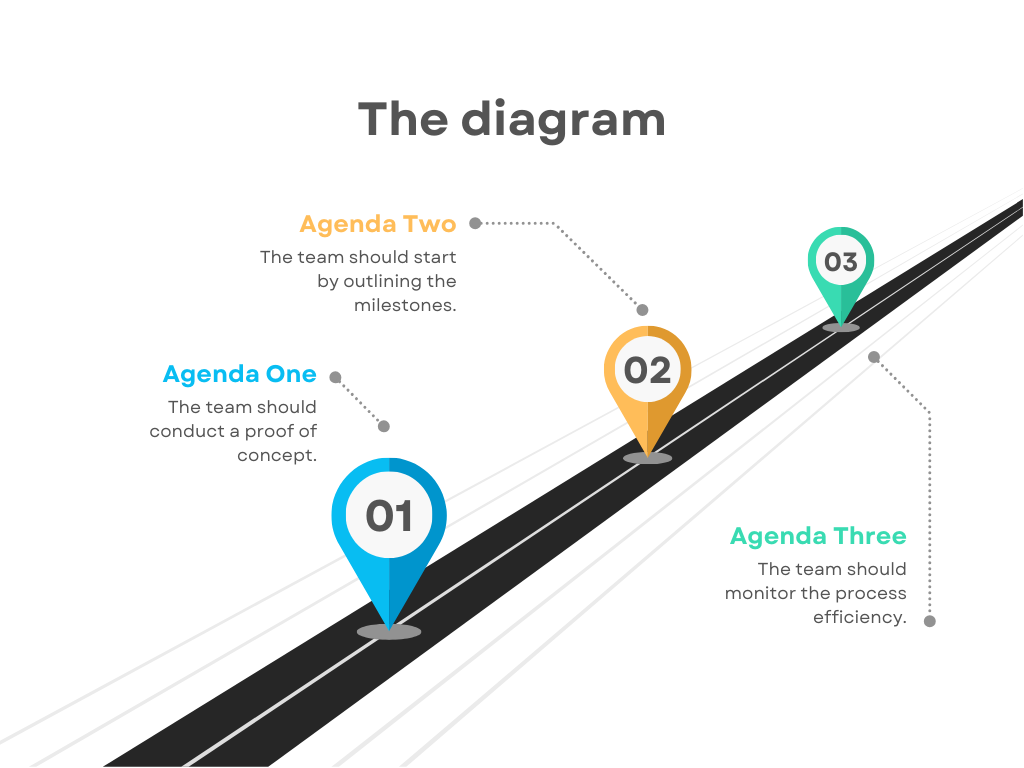
To create it you must:
Identify a priority situation that your company wants to address. For example, poor work environment, turnover rate, need to increase sales, or lack of personnel.
With the data, arrange the graph from the most significant problem to the least significant. For example, work environment 36%, working conditions 9%, lack of recognition 10%, organizational culture 15%, and relationship with colleagues 30%.
From this, we can infer that the work environment and the relationship with colleagues represent just over 80% of the causes of turnover. Thus, HR can focus on improving these two aspects, instead of distributing their efforts on causes that have less or almost no impact on their staff turnover rate.
It can also be applied to productivity. In all jobs, we engage in tasks that are less relevant, such as holding endless meetings, sending emails, completing spreadsheets. We can think about how to concentrate 80% of the effort on what brings the most results, shrinking or automating routine tasks that don’t add value.
It’s useful for investments. When you plot the graph, you realize that there are essential inputs for your venture or company and others that are not as crucial. The diagram helps you prioritize expenses to save money.
For quality control. It can be determined that 20% of defects will affect 80% of processes. In this way, companies can focus on addressing the most relevant errors, as they are the ones that have the greatest effect on the results.